
Abu Dhabi Property Prices per Square Metre, 2021–2026
How Abu Dhabi prices per square metre moved from 2021 to 2026, what ADREC confirms for H1 2026, and why community-level 'growth' tables are easy to misread.
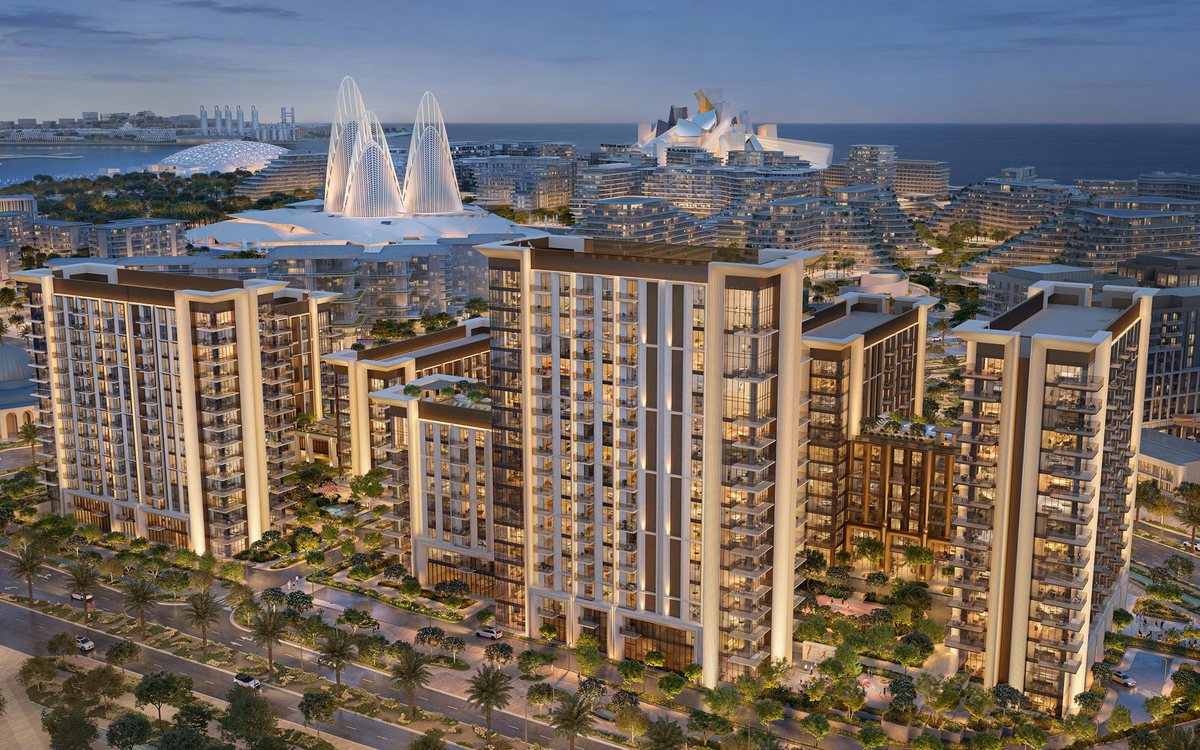
I recently prepared a short video comparing prices per square metre in seven Abu Dhabi communities in 2021 and 2026 — Najmat, Shams, Al Raha Beach, Yas Acres, Water's Edge, Hidd Al Saadiyat and the Noya, Viva and Luma projects on Yas. The numbers came from a third-party listings-and-transactions tool, and some of the moves were dramatic: on paper, several communities roughly doubled.
I am not publishing that table here. I could not verify the source data or its method against an official document, and some rows compared an off-plan launch price with a ready resale price. Publishing unverified medians would be the opposite of what this section is for. Instead, here is what the official data does confirm, and how to read any community-level table you come across.
What ADREC confirms
ADREC's H1 2026 market report, which we summarise on our market page, gives emirate-level signals that point the same way as the anecdotal tables, without overstating them:
- Apartment resale prices rose about 20% over twelve months, after about 15% the year before — the pace of increase accelerated.
- Apartments trading above AED 28,000 per square metre tripled in value year on year and now account for 46% of the market.
- In most districts, maximum prices run two to four times the district average, which tells you how wide the spread inside a single community can be.
That is a strong multi-year rise. It does not support a single "+X% everywhere" claim.
Why community "growth" tables mislead
Different baskets. A 2021 median for a community is an average of whatever traded that year. If 2021 sales were mostly older one-bedrooms on low floors and 2026 sales are mostly new three-bedrooms with sea views, the median rises even if no individual home changed value.
Off-plan versus ready. Yas projects like Noya, Viva and Luma were first sold off-plan. Comparing a 2021 launch price per square metre with a 2026 price for a completed or nearly completed home measures both market growth and the move from plan to finished product. Those are different things.
Layout and area definitions. Some sources use built-up area, some include balconies and terraces, some use plot area for villas. A difference in definition can look like a price movement.
View, floor and condition. In Abu Dhabi's island markets, a sea view or a high floor can be worth a large premium. A handful of premium sales can move a small community's median.
Thin data. Smaller communities may have few trades in a period, so one sale can swing the figure.
How I use price per square metre
I use it as a starting point for comparing similar units, never as a forecast:
- Compare the same type, size band and stage — ready with ready, off-plan with off-plan.
- Use recent transactions, not listings — asking prices are not deal prices.
- Adjust for view, floor, condition and service charges.
- Check how much new supply is due in the same community.
My take
The direction over 2021–2026 is clear: Abu Dhabi prices have risen substantially, and the top of the market has grown fastest. The size of the move in any single community is much less clear than a viral table suggests. If someone shows you "+100% in five years", ask what was being compared with what. And remember the reason ADREC itself gives for caution: market data describes what happened. It does not tell you what will happen next. For where I would currently be careful, see where I am careful buying off-plan.
Analysis and opinion by Astana Real Estate / Yeldar Nurmukanov. Market conditions, prices and availability can change. This is general information, not investment, tax or legal advice.
Sources
- ADREC — Abu Dhabi Real Estate Market Report H1 2026 press release
- Astana Real Estate — Abu Dhabi Property Market H1 2026 — our summary of the ADREC report, including resale price growth and price-band distribution